Introduction
Microsoft Excel is a powerful spreadsheet application that is widely used for various tasks, including data analysis, budgeting, project tracking, and reporting. Whether you’re a student, a professional, or just someone wanting to organize their personal data, learning how to use Excel can be a valuable skill. This guide will walk you through the very basics of getting started with Excel, from understanding its interface to performing common tasks like creating formulas and charts.
What is Microsoft Excel?
Microsoft Excel is part of the Microsoft Office suite of programs and is designed for creating, organizing, and analyzing data. It operates on a grid system where information is entered into rows and columns, making it ideal for managing large datasets. Excel can be used for simple calculations or complex data analysis, and it supports various functions such as sorting, filtering, and graphing data.
Getting Started with Excel: The Interface
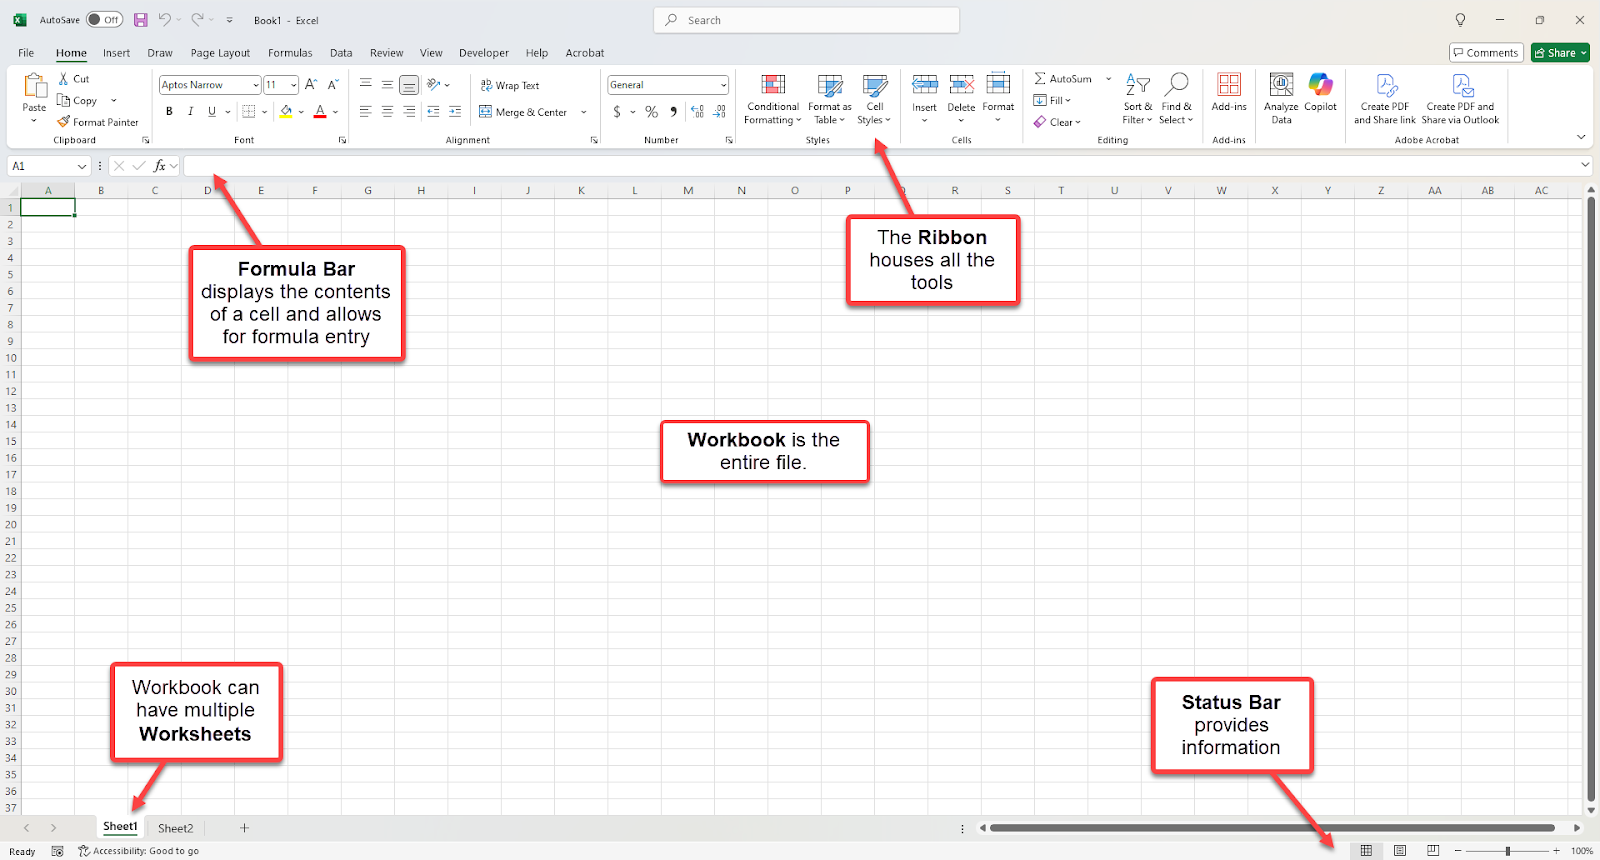
When you open Excel, you’ll be greeted by a clean and straightforward interface. Here are the key components of the Excel interface:
- Workbook: This is the entire file that you work within. A workbook can contain multiple sheets.
- Worksheet: Each individual sheet within a workbook. It’s organized in rows (numbered) and columns (lettered). You enter your data into the cells at the intersection of rows and columns.
- Ribbon: At the top, you’ll find the Ribbon, which contains tabs like “Home,” “Insert,” “Page Layout,” and “Formulas.” Each tab houses specific tools and options to help you manipulate and format your data.
- Formula Bar: Located at the top of the spreadsheet, the Formula Bar displays the contents of the currently selected cell. It’s also where you can enter or edit formulas.
- Status Bar: This is located at the bottom of the screen and provides information about your current selection or Excel’s status, like the sum of selected cells.
Basic Excel Terminology
Before diving into creating spreadsheets, it’s important to familiarize yourself with some key Excel terminology:
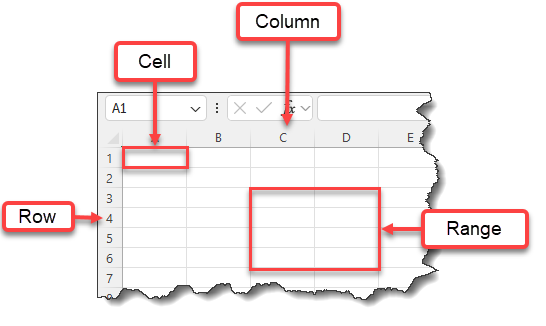
- Cell: The basic unit where data is entered. It’s represented by the intersection of a column and a row (e.g., A1, B3).
- Range: A selection of multiple cells (e.g., A1:C5).
- Column: A vertical section of cells, identified by letters (A, B, C, etc.).
- Row: A horizontal section of cells, identified by numbers (1, 2, 3, etc.).
- Formula: A mathematical equation used to perform calculations on your data.
- Function: Predefined formulas that make complex calculations easier (e.g., SUM, AVERAGE, COUNT).
Creating Your First Spreadsheet
- Open Excel: Start by launching Microsoft Excel. You will be presented with a new workbook.
- Enter Data: Click on any cell and begin typing to enter your data. Press Enter or Tab to move to the next cell. You can use the arrow keys or the mouse to navigate between cells.
- Resize Columns and Rows: If you need more space to display your data, hover over the line between column labels (e.g., between A and B) or row numbers, then drag to resize them.
- Save Your Workbook: Click on the “File” tab in the Ribbon and select “Save As.” Choose where you’d like to save your file and give it a name.
Using Basic Functions and Formulas
One of the primary strengths of Excel is its ability to perform calculations using formulas. Let’s look at a few common ones:
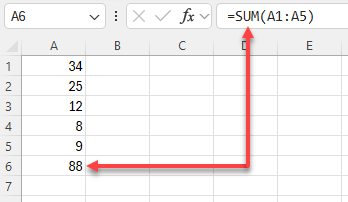
- Sum: Add up a range of cells. Type =SUM(A1:A5) to add the values from A1 to A5.
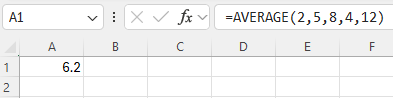
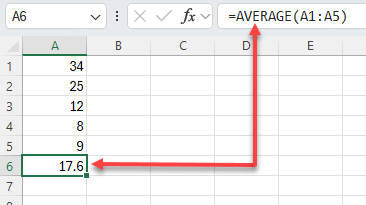
- Average: Calculate the average of a range of cells. Type =AVERAGE(B1:B5) to find the average of values in B1 through B5.
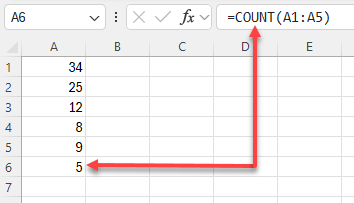
- Count: Count the number of cells that contain numbers. Type =COUNT(C1:C5) to count the numeric entries from C1 to C5.
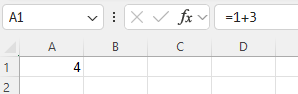
How to Enter a Formula:
- Select a cell where you want the result.
- Type an equal sign (=) to begin.
- Enter the function or formula, for example, =SUM(A1:A5).
- Press Enter to see the result.
Formatting Data for Clarity
Excel provides numerous formatting options to make your data easier to read and more visually appealing:
- Bold, Italic, Underline: Use these options in the “Home” tab to emphasize certain data.

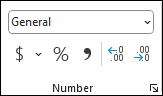
- Number Formatting: You can format numbers as currency, percentages, dates, or simple numbers. Select the cells, then choose the appropriate format in the “Number” group.
- Conditional Formatting: This feature allows you to apply specific formatting based on cell values (e.g., coloring cells with values greater than 100 in red).

- Cell Borders and Shading: Enhance your data’s presentation by adding borders or shading specific cells.

Creating Charts
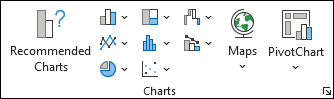
Charts help visualize your data, making it easier to understand and share. Excel offers a variety of chart types, including bar, line, pie, and more.
- Select Your Data: Highlight the range of data you want to chart.
- Insert a Chart: Go to the “Insert” tab on the Ribbon and choose a chart type from the “Charts” group.
- Customize the Chart: After inserting the chart, you can further customize it using the Chart Tools that appear in the Ribbon. Change colors, add labels, and adjust the title.
Sorting and Filtering Data
Sorting and filtering allow you to analyze and view specific data subsets:
- Sort: Click on a column header, go to the “Data” tab, and select either “Sort A to Z” or “Sort Z to A” to organize your data.
- Filter: Highlight the data range, click “Filter” under the “Data” tab, and use dropdown arrows to filter data based on specific criteria (e.g., show only entries greater than $100).

Saving and Sharing Your Work
Excel offers various ways to save and share your work:
- Saving Locally: Save your file on your computer by clicking “File” > “Save As.”
- Saving to OneDrive: For cloud storage and easy access from any device, save your workbook to Microsoft’s OneDrive.
- Sharing Your Workbook: You can also share your Excel file with others by clicking “File” > “Share” and choosing how you’d like to share it (via email, link, etc.).
Advanced Features to Explore
Once you’ve mastered the basics, you can dive into more advanced features like:
- PivotTables: Analyze large data sets by summarizing and organizing data.
- Macros: Automate repetitive tasks with recorded actions.
- VLOOKUP/HLOOKUP: Search for specific data in large tables.
- Data Validation: Set rules to control what can be entered into specific cells.
Conclusion
This Beginners Guide was simply to introduce you to Microsoft Excel – to open the door ever so slightly. Future blogs and documentation will slowly broaden into all the capabilities of Excel as we dig deeper and deep into the software’s capabilities. Due to the fact that Microsoft Excel is an incredibly versatile and complex we will onboard into this tool in an ever increasing way. Starting with the basics, such as entering data, creating formulas, and formatting, will build a solid foundation for more advanced tasks. As you get comfortable, you can explore more complex features like pivot tables, charts, and automation. Excel’s power lies in its simplicity and flexibility, making it an invaluable resource for both personal and professional use.